Excellent lessons learned from David Savary (University of Tours) on an often overlooked topic: the resilience of the application mapping itself.
When the network goes down, that’s precisely when the mapping becomes critical… and yet often inaccessible. The solution presented is simple, pragmatic, and effective: automated Mercator exports, enriched by queries, stored offline via Nextcloud, and directly aligned with the institution’s Disaster Recovery Plan (DRP).
Result: an operational mapping in a crisis situation, usable even without a functional IT system. This is exactly what we expect from a mature security approach.
Also an excellent example of mapping/monitoring convergence with Zabbix to keep data alive over time.
Organization of application mapping resilience with open-source tools
By: David Savary
IT Project Coordinator
January 10, 2026
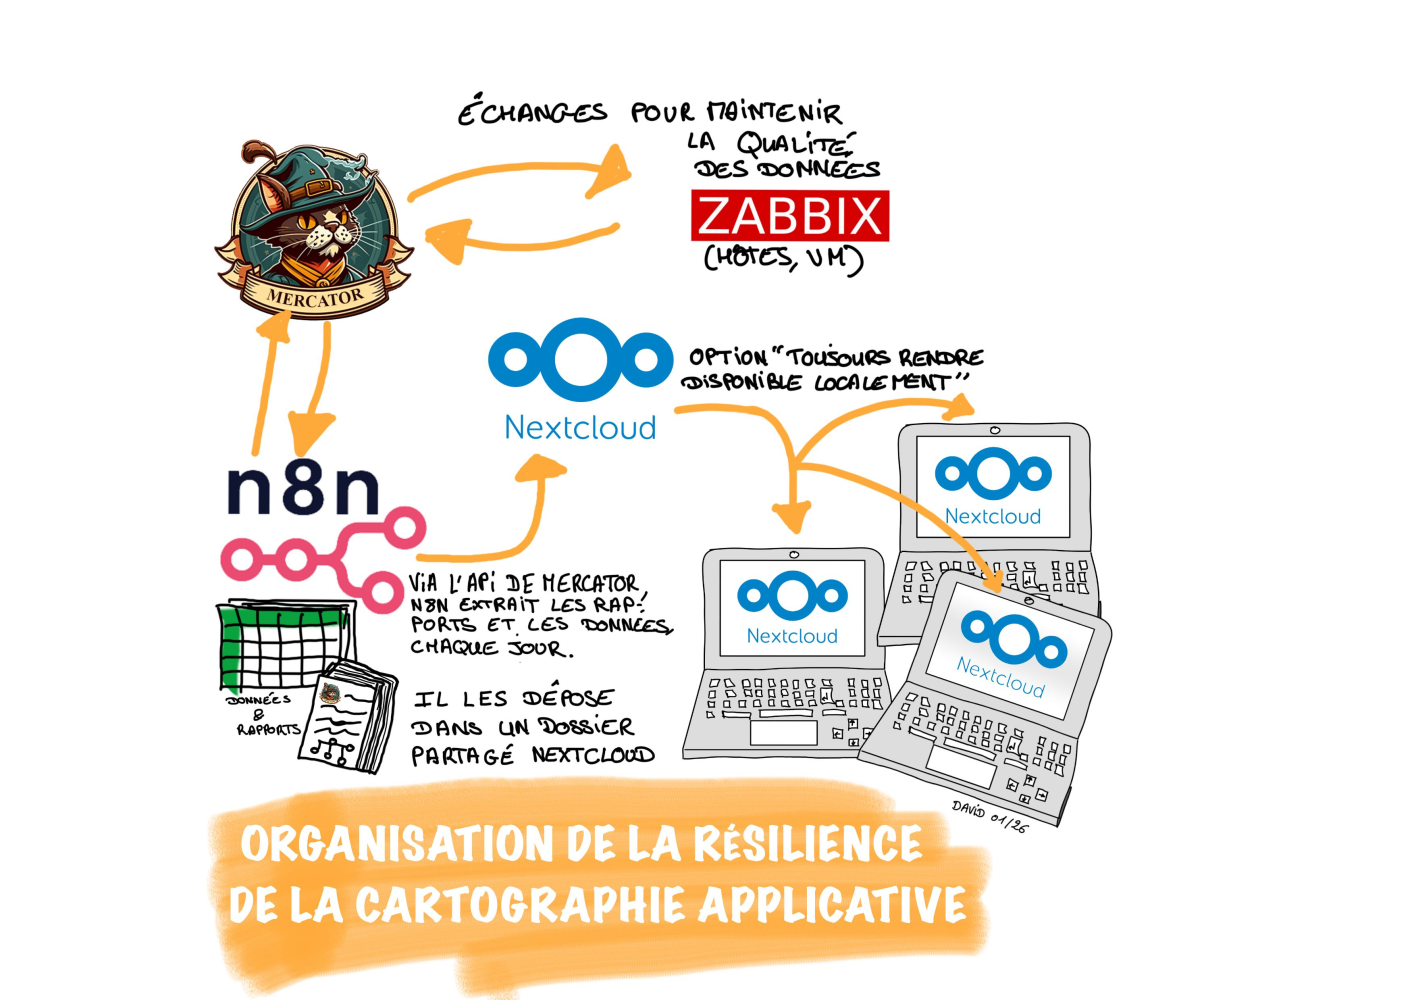
💡 Following our participation in #Rempar25 organized by ANSSI - the French National Cybersecurity Agency (ANSSI), the idea of having access to the Information System (IS) application mapping information in case of a network outage quickly became essential at my institution, the University of Tours. Technically, the solution we built is supported by three open-source components: #Mercator for mapping, #Zabbix for host monitoring, and #Nextcloud (self-hosted) for storage and sharing. A fourth, less open-source component, #n8n, is used for creating data flows. of automation.
🔁 If the network is down, access to Mercator, and therefore to the mapping, is impossible. This is a bit of a challenge because if there’s ever a time in life when you want to be able to rely on it, it’s during the resolution of a cyber incident…
So, we had the idea of leveraging the reports that Mercator generates on demand. They cover a large area of the IT system, sufficient for an initial experiment. We therefore created a flow in n8n that connects to the Mercator API to generate daily exports of all the reports offered by the application. We supplement these with queries on the tables. These queries will, for example, extract the mapped applications and classify them according to criteria or keywords entered in Mercator. We are currently using this process to group the applications into circles that determine the order in which we must restart the IT system; this is the implementation of the Disaster Recovery Plan (DRP) adopted by the university. from Tours, which describes the resumption of activity as a series of concentric circles. This modus operandi is now part of our cyber crisis management organization.
🖧 To have access to reports and query results when the network or internet connection is down, they are uploaded via the n8n stream to a folder on our Nextcloud instance. This folder is shared and synchronized across several computers in our department, in “always available on device” mode. When an incident occurs, even if the network is down, we still have access, offline and on multiple terminals, to the entire application map thanks to information from Mercator, refreshed daily.
❓ And what about Zabbix in all this? This monitoring tool was used at the beginning of our project to load hosts and VMs into Mercator in bulk. Then we agreed on tags placed in Zabbix, which allow us to link the data in Zabbix with that in Mercator. The idea, which While not yet fully implemented, the goal is to automate regular data exchanges between the two applications to help us keep information up-to-date on both sides.
👏 This post is absolutely not the result of a commercial partnership, but I would like to thank Didier Barzin, Mercator developer, through Sourcentis, for his support in our project, and in particular for providing the API endpoints that now allow us to download Mercator reports. And of course, Laurent Beunèche, the university’s #CISO, the true driving force behind this initiative, supported by Francis Herry #adminsys, and initiated by Marc Le Bris (IT Director).
Source: LinkedIn